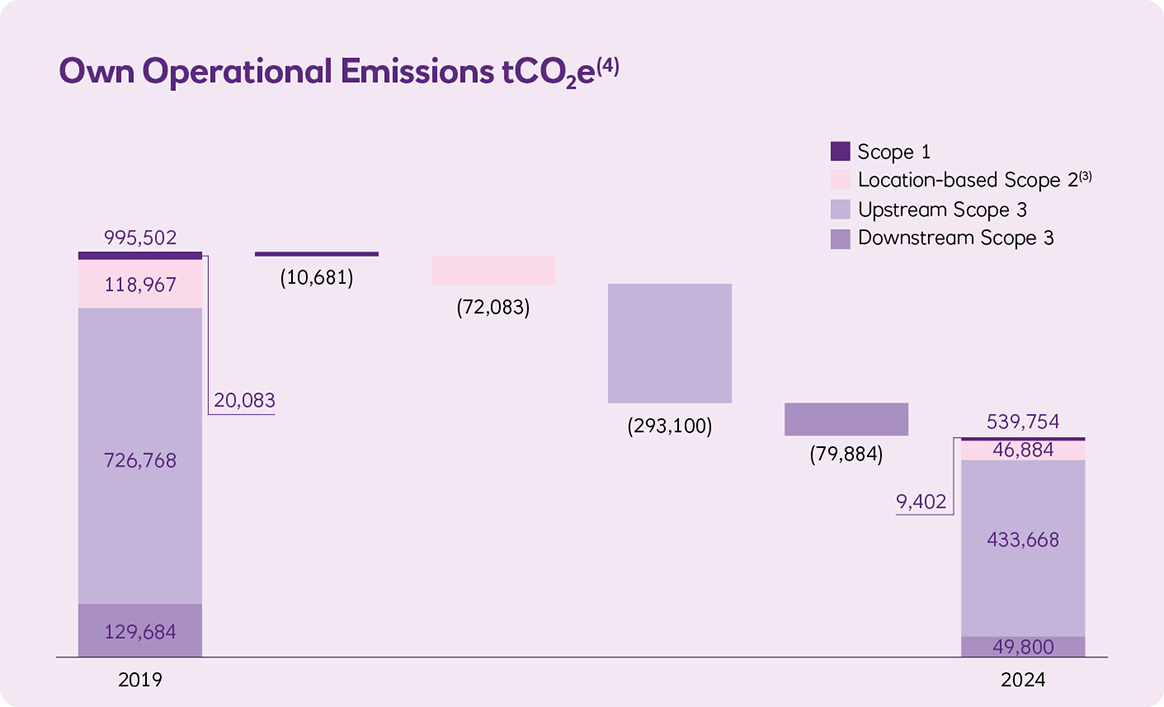
The waterfall chart discloses our own operational emissions between 2019 and 2024, including our upstream and downstream Scope 3 emissions. This includes emissions from our direct own operations as well as the wider operational value chain, in line with our 2030 and 2050 ambitions. Our own operational emissions4 have reduced by 46%, 455,748 tCO2e, between our 2019 baseline and 2024 reporting year. The most material reduction in emissions occurred within upstream Scope 3 categories 1, 2, and 9 as well as location-based Scope 2 emissions. Scope 3 emissions reductions result mainly from our supply chain decarbonising, with location-based Scope 2 emissions reductions from grid greening as more renewable electricity is added to national electricity grids, energy efficiency work undertaken across our portfolio and portfolio right-sizing.
For further details of drivers for Scope 1 and Scope 2 reduction activities in 2024, refer to page 48 of the 2024 Annual Report and Accounts
Our supply chain emissions formed 65% of our 2024 operational emissions, offering a key opportunity for decarbonisation.
- Total supply chain emissions have reduced by 40% between 2019 and 2024.
- As we predominately use spend-based methods, changes in influenced spend5 will directly impact emissions.
- An update to the industry-average emission factor database has been the main contributor to the reduction in purchased goods and services emissions in 2024. Therefore, we continue to work with suppliers to obtain supplier-specific data to reduce our reliance on industry averages emission factors and to measure supplier emissions trajectory to help inform choices across our supply chain.
Refer to the 2024 Sustainability Basis of Reporting for further details of our updated methodology.
(1) NatWest Group defines direct own operations as our Scope 1, location-based Scope 2 and Scope 3 (paper, water, waste, business travel, commuting and work from home) emissions. It therefore excludes upstream and downstream emissions from our value chain. The term ‘direct own operations’ will be retired from 2025 onwards following achievement of our 2025 ambitions.
(2) Our ambition is location-based to drive absolute reductions in consumption. Location-based GHG emissions method reflects the average emissions intensity of grids on which energy consumption occurs (using grid-average emission factors). Market-based emissions reflect emissions from electricity procured from sources NatWest Group has selected, including renewable electricity. As renewable sources have nearly zero emissions associated with energy generation, market-based emissions are lower than location-based emissions. Refer to Streamlined Energy and Carbon Reporting (SECR) disclosure, included on page 50 of the NatWest Group plc 2024 Annual Report and Accounts, for further details of the basis of GHG emissions reporting.
(3) Our 2019 baseline runs from 1 October 2018 to 30 September 2019.
(4) Our own operational emissions reporting year runs from 1 October to 30 September. Our operational footprint includes greenhouse gas emissions Scopes 1, 2 and 3 (Categories 1-14, excluding Categories 8, 10, 14). For details of the Greenhouse Gas Protocol including upstream and downstream refer to diagram of scopes and emissions across the value chain.
(5) Influenced spend is spend associated with the procurement of purchased goods and services in which NatWest Group directly controls. It does not include spend categories such as regulatory fees, commission and general fees, international taxes, customer passthrough costs, and spend attributed to emissions in other categories/scopes of our carbon footprint.