If you cannot see the graphic or access the links within this message please go to the source
|
 |
|
Offices vs WFH: A tale of sound and fury signifying nothing
| Few property-related topics seem to attract as much impassioned debate as the supposed face-off between office working and working from home. However, the spectacle increasingly resembles an angry old man arguing with himself inside a phone box. PR teams seem to be working around the clock to push stories of major corporations “ordering” their employees back to the office five days a week, but the narrative would be somewhat more compelling if it wasn’t the same handful of corporate names that are repeatedly referenced. The strange thing about the debate is that it is framed as a binary fight to the death between working communally in an office or working alone at home.
Yet, two facts seem to be generally accepted: Firstly, that most businesses still function best with regular time spent in the office, but also that many employees appreciate the benefits of having flexibility for part of the week. The seemingly obvious conclusion is that whilst flexible working is here to stay, it does not represent an existential threat to the existence of offices themselves. |
Surveys and anecdotal evidence paint a diverse picture but imply that the majority (of larger employers at least) have settled on a hybrid framework that mandates a minimum number of office days per week, with the option for some remote working for those that want it. Data from Virgin Media O2 suggest that 75% of employees commuted for 3 or more days a week in 2024, supporting the theory that most employers want regular office attendance. However, the narrative that there is an inexorable trend back towards five days a week is somewhat undermined by geolocational data from the same company showing that total commuting journeys into major towns and cities declined by 7% last year.
Department for Transport data adds further nuance to this, showing that whilst London is 15% less busy than before Covid, the major regional cities are back where they were in 2019. The reality is that neither the remote-working evangelists, nor the full-time office militants represent the majority view. Another bit of data from Virgin Media O2 shows that on Mondays and Wednesdays two-thirds of all employees are in the office, suggesting that in most individual offices peak days won’t be much different to their pre-Covid levels. |
|
Commercial property returns
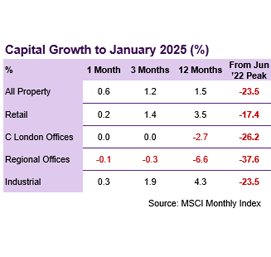
According to MSCI, average commercial property values increased by 0.6% in January, and have now recovered by a cumulative 2.1% since last April. Nonetheless, average values are still 23.5% below their June ’22 peak, despite rental values increasing by 9.5% over the same period.
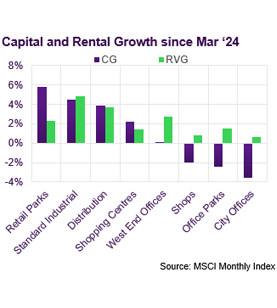
Retail Warehouses have been the strongest performing sub-sector over the last 12 months, with capital growth of 5.6%. This has been underwritten to some extent by rental growth of 2.4%. In contrast, shop values have continued to decline (-2.7% year-on-year) despite also benefiting from some degree of rental growth (+1.3% year-on-year).
The recovery in Industrial values picked up pace through 2024, and annual growth reached 4.3% in January. This recovery has been fully underwritten by rental growth (5.4% year-on-year), even though this has slowed materially from the double-digit growth rates recorded in 2022.
Capital values in the office sector are down by 5.7% year-on-year on average, but with wide variation across regions. In East Anglia, average values are down by just 1% y-on-y, driven largely by growth in Cambridge. In contrast, values in Scotland are reported to be down 17.8% y-on-y, although it’s worth noting that this is based on just 11 assets. |
|
Investment market activity
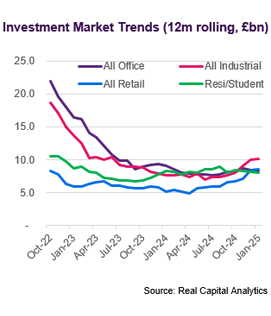
Preliminary data from Real Capital Analytics indicate that £2.5bn of transactions completed in January; a relatively slow opening month even by recent standards. Heightened volatility in the bond market in January no doubt played a part in the hesitant start to the year.
The largest deal in January was the £453m acquisition by Norges of a 25% stake in a Mayfair Joint Venture with Grosvenor. The portfolio, which will continue to be managed by Grosvenor, includes 175 predominantly office and retail assets located around Grosvenor Street and Mount Street.
Retail warehouses, the most liquid retail sub-sector, continue to be dominated by US investor Realty Income Corp, who acquired 3 parks from Ashby Capital in January for £220m. According to RCA data, over the last five years Realty have acquired 135 UK retail warehouse and supermarket assets across 99 transactions at a total cost of £3.5bn.
The first significant logistics portfolio of the year completed within the first few days, with Indurent (the Blackstone company formed by Industrials REIT and St Modwen) acquiring 18 warehouses from PGIM for £200m. The sector also delivered the largest single asset transaction in January with the purchase by Valor and Quadreal of a Tesco distribution centre in Thurrock for £130m.
The Living sectors ticked over at the start of the year with a range of mid-sized deals. The JV between CPPIB and Kennedy Wilson were most active, acquiring 650 homes from deals with three different housebuilders for a total commitment of £213m. Elsewhere, a JV between Greykite and Gatehouse Bank committed £60m to acquire single-family homes in the Midlands and the South-West from Persimmon.
|

Market yields
Since a high of almost 5.0% in January, Gilt yields have dropped back to around 4.5%, relieving the upward pressure on property yields. Indeed, JLL do not consider any of the 52 benchmarks they monitor to be under short-term outward pressure. In contrast, they judge that 14 commercial property benchmarks are more likely to harden over the short-term.
The only actual change JLL have made to any of their commercial sub-sector benchmarks over the last month is a 25bp hardening of prime high street from 7.0% to 6.75%. It is hard to point to any deals in the public domain which illustrate the point, but the estimate is in line with that of peers at CBRE. JLL perceive that benchmark yields for dominant shopping centres, prime and secondary retail parks are also likely to come in further in the short-term.
Within the office sector, JLL consider that yields for the largest prime City assets have stabilised at 5.75%, whilst mid-sized City lots could firm up from the current level of 5.5%. All other office benchmarks are deemed to be stable at current levels. All prime and secondary Industrial benchmarks are considered to be trending stronger from a current 4.75% - 5.25% range.
In contrast, JLL estimate that benchmarks for regional (direct-let) student accommodation have moved out over the last month. Benchmarks for Super Prime and Prime regional are deemed to have softened slightly to 5.25% and 5.5% respectively. All benchmarks for PBSA and BTR are now considered to be stable, with prime yields ranging from 4.0%-5.5%. |
Auctions
Allsops commercial auction in February raised £41m from sales, significantly down on the total of £55m raised from the same auction last year. Of 60 lots available on the day, just 28 were sold at auction, reflecting a relatively low success rate of 47% on the day. However, the 31 sales agreed prior to and post the auction illustrate that buyers do remain active at the right price.
Sales agreed prior include the Leyton delivery office, with short income but clear development potential, which achieved over £4m. Auctions have become a reliable avenue for selling local shopping centres, with the White Rose centre in Rhyl selling for £2.1m, a notional initial yield of 26%. |
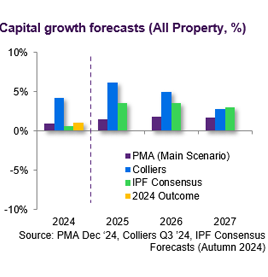
Market forecasts
The Consensus Forecast compiled by the IPF in Autumn last year predicted cumulative average growth of just over 10% across the three years to 2027. The consensus number is the average taken from 17 contributors who submitted their forecasts between September and November 2024.
The consensus was for Industrial assets to outperform over the three-year period, with average cumulative growth of around 15%. Although rental growth is expected to slow somewhat relative to recent years, rents are still expected to rise by a cumulative 10% by 2027.
Retail warehouses were the strongest performing sub-sector in 2024, with capital growth of c5%, and the consensus view is that their recovery will continue, with cumulative growth of almost 10% over 3 years. The shopping centre recovery is expected to be more muted (+3.5% over 3 years).
There is a wide spectrum of views on offices for 2025, with capital growth forecasts ranging from a further decline of 1.7% to fairly robust growth of 5.5%. Over the three years to 2027, the consensus forecasts is for cumulative capital growth of circa 6%. Contributors typically expected the West End market to outperform other regions, with cumulative growth of c10% over 3 years.
|
|
Looking forward
Regardless of where you stand on the WFH debate, it is clear that liquidity for office assets is a fraction of what it has been historically, with total investment of just £8.5bn last year. This compares to an average of £21bn between 2015 and 2022, a period which was rocked by Brexit, Covid and the war in Ukraine. Uncertainty about approaches to remote working is clearly one factor, but that was also true for 2021 and 2022, years which delivered twice as much investment as 2024. It is to state the obvious that interest rates have been a significant brake on the market. Prime office assets were typically low yielding at the inflection point in the rates cycle, which left values heavily exposed and made interest cover a significant challenge as all-in financing costs doubled. However, another significant factor, which is particularly acute for offices, is obsolescence. This has always been a key consideration for office investors but has become even more so now that energy efficiency and environmental sustainability are at the forefront. The cost of renewing older space has now become perhaps the defining factor for the assessment of an asset’s viability.
|
Visit us
Discover a wealth of
real estate expertise, regardless of your business level or stage.

|
| So where does the market go from here? There are a number of supportive factors. From a macro point of view, rates are now on a down cycle, even if the terminal rate may not be as low as many had hoped. From an occupier markets perspective, average rental values have been ticking up over the last year, whilst prime rents for the best space have surged in most cities. This is a function of two key factors: Firstly, aggregate office-based employment has continued to rise in spite of the weak economy. Secondly, the office development pipeline has been severely constrained and therefore the supply of available grade A space has declined. So, whilst some office workers may enjoy fewer days commuting and perhaps slightly less crowded trains, the competition for desk space in the best locations is unlikely to be any less intense than it has been in the past. |
|
|
If you would like to opt out, please get in touch with your Relationship Manager.
This document has been prepared by National Westminster Bank Plc or an affiliated entity (“NatWest”) exclusively for internal consideration by the recipient (the “Recipient” or “you”) for information purposes only. This document is incomplete without reference to, and should be viewed solely in conjunction with, any oral briefing provided by NatWest. NatWest and its affiliates, connected companies, employees or clients may have an interest in financial instruments of the type described in this document and/or in related financial instruments. Such interests may include dealing in, trading, holding or acting as market-maker in such instruments and may include providing banking, credit and other financial services to any company or issuer of securities or financial instruments referred to herein. NatWest is not and shall not be obliged to update or correct any information contained in this document. This document is provided for discussion purposes only and its content should not be treated as advice of any kind. This document does not constitute an offer or invitation to enter into any engagement or transaction or an offer or invitation for the sale, purchase, exchange or transfer of any securities or a recommendation to enter into any transaction, and is not intended to form the basis of any investment decision. This material does not take into account the particular investment objectives, financial conditions, or needs of individual clients. NatWest will not act and has not acted as your legal, tax, regulatory, accounting or investment adviser; nor does NatWest owe any fiduciary duties to you in connection with this, and/or any related transaction and no reliance may be placed on NatWest for investment advice or recommendations of any sort. Neither this document nor our analyses are, nor purport to be, appraisals or valuations of the assets, securities or business(es) of the Recipient or any transaction counterparty. NatWest makes no representation, warranty, undertaking or assurance of any kind (express or implied) with respect to the adequacy, accuracy, completeness or reasonableness of this document, and disclaims all liability for any use you, your affiliates, connected companies, employees, or your advisers make of it. Any views expressed in this document (including statements or forecasts) constitute the judgment of NatWest as of the date given and are subject to change without notice. NatWest does not undertake to update this document or determine the accuracy or reasonableness of information or assumptions contained herein. NatWest accepts no liability whatsoever for any direct, indirect or consequential losses (in contract, tort or otherwise) arising from the use of this material or reliance on the information contained herein. However, this shall not restrict, exclude or limit any duty or liability to any person under any applicable laws or regulations of any jurisdiction which may not be lawfully disclaimed. The information in this document is confidential and proprietary to NatWest and is intended for use only by you and should not be reproduced, distributed or disclosed (in whole or in part) to any other person without our prior written consent.
National Westminster Bank Plc. Registered in England & Wales No. 929027. Registered Office: 250 Bishopsgate, London EC2M 4AA. National Westminster Bank Plc is authorised by the Prudential Regulation Authority, and regulated by the Financial Conduct Authority and the Prudential Regulation Authority.
|
|
|