If you cannot see the graphic or access the links within this message please go to the source
|
 |
|
Student Halls: A first-class investment or time to drop out?
| Student accommodation has been a darling of the real estate sector over the last decade and has proven more resilient than most to the interest rate shock since 2022. Although yields have shifted out, the impact has been mitigated by very healthy rental growth, and as a result values have held up relatively well. Indeed, CBRE report that in the 12 months to September, PBSA (Purpose Built Student Accommodation) values rose by an average of 4%, delivering an annual total return of almost 10%.
However, behind these attractive property returns, dark clouds are lurking. In the medium to long-term, property returns are of course reliant on higher education institutions continuing to attract students in sufficient numbers, and the financial circumstances of many of these institutions are less robust than one might expect given the growth in total student numbers over the last decade.
HESA data shows that the total number of full-time students increased by almost 30% in the 10 years to 2022/23, adding almost half a million potential customers to HE institutions and providers of student accommodation. |
This rapid growth represented a gold rush to PBSA investors who were able to charge ever higher rents as demand for beds outstripped supply. However, warning signs have been emerging in recent years. Institutions have been restricted by the freeze on the domestic fee cap, and both they and the real estate sector have become increasingly reliant on overseas students to drive revenues.
They will have been alarmed therefore, by UCAS data showing that acceptances from overseas students fell by 3% last year, to their lowest level for five years. There were hopes for a strong recovery this year, but these appear to have been dashed. Analysis from the OFS released this month suggest that whilst institutions had been forecasting a 6.6% increase in overseas students this year, lead indicators imply a 16% decline. OFS modelling suggests that, without mitigating action, and despite the announced unfreezing of the fees cap, almost three in four HE institutions will be in deficit by the 2025/26 academic year. |
|
Commercial property returns
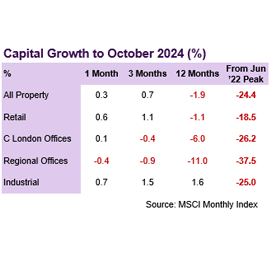
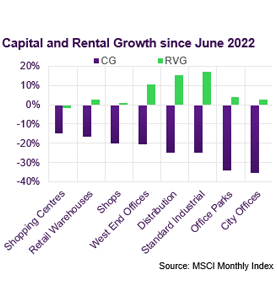
According to MSCI, average commercial property values edged up by 0.3% in October, and by 0.7% over the last 3 months, and are now back where they were at the start of the year. Nonetheless, capital values remain on average 24.4% below their June 2022 highwater mark.
Retail Warehouses have been the strongest performing sub-sector so far this year. This outperformance has been driven by Retail Parks (+4.2% YTD) more than Solus Units (+1.1%). In contrast, Shopping Centre and Supermarket values have been broadly flat this year, whilst Shop values have continued to drift downwards (-3.3% YTD).
Industrial values have been edging up gradually since March, and that recovery has picked up pace in recent months. Average values in the sector are now 2.2% higher than they were at the start of the year. Yet, capital values are still 25% off their June ’22 peak, even though rental values have risen by 16.5% on average over that same period.
Offices remain the underperformer, with values off by 5.4% on average so far this year. The rate of decline has moderated in recent months, with the East of England (driven by Cambridge), and the West End appearing most resilient. In contrast, office values in Scotland have declined by a further 4.3% over the last 3 months and by 15.8% so far this year.
|
|
Investment market activity
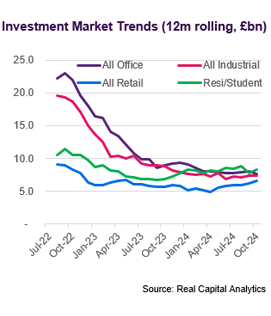
Preliminary data from Real Capital Analytics suggest that £2.3bn worth of transactions closed in October. Although activity dipped slightly month-on-month, YTD totals are 7.5% higher than the equivalent period in (an exceptionally weak) 2023. The comparison with the preceding year is less flattering however, with YTD volumes running at about 60% of 2022 levels.
British Land continued their conviction move into Retail Parks, acquiring seven from Brookfield for £440m. BL raised £300m from a share placing to fund the deal, which followed a £172m purchase of two other parks from Brookfield in September. The 1.8m sq ft portfolio, yielding 6.7%, will take BL’s weighting in Retail Parks to around a third.
The largest single-asset deal of the month was the sale by Segro of an industrial estate in Ealing to Imperial College for £115m. The university plan to redevelop the 10-acre site as part of its WestTech Corridor of science and innovation hubs. Segro acquired the site as part of its acquisition of Brixton in 2009, with an estimated allocated value of £20m.
In the largest regional office deal of the year so far, M&G sold Central Square in Leeds to Ashtrom for £78m. M&G, who developed the asset speculatively in 2016, put the asset on the market in April for £80m. They have also been marketing 3 Forbury Place in Reading and Two Snowhill in Birmingham as part of a broad regional office disposal programme.
A JV between Meadow Partners and Roadside Real Estate made their largest investment to date, with the commitment of £70m to acquire 12 new Lidl supermarkets. The assets, which are currently under construction and expected to complete within the next 6 months, are being sold by Lidl and will be leased back for 25 years with annual indexation. |
Market yields
A mixed picture on inflation, and a cautious reaction to the budget, has impacted materially on medium-term interest rates over the last two months despite the cut in base rate. From a low of around 3.75% in mid-September, the ten-year Gilt yield has reached 4.5% in recent weeks. Alongside a sharp rise in swap rates, this has stifled emerging signs of yield compression.
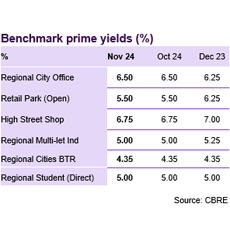
Amongst the mainstream commercial sectors, CBRE only anticipate stronger pricing in the short-term for prime and good secondary Industrial estates outside of London. These benchmarks are currently at 5.0% and 6.0% respectively, although investors are typically acquiring at keener initial yields in the expectation of short-term reversion.
CBRE now consider that prime retail park yields are stable at 5.5% (open) and 5.75% (Bulky), both in from 6.25% at the start of the year. The prime solus and secondary park benchmarks are also considered stable at 5.5% and 7.5% respectively, having hardened by 75bp and 50bp since January.
Regional office benchmarks range from 6.5% for prime regional cities to 14% for secondary. In truth, the former may be closer to 7.0% given emerging evidence from high quality assets currently on the market. There is scant evidence of the latter, with offers in the space often being derived from a perceived £/sq ft value rather than on a yield basis
|
Auctions
Allsop’s commercial auction in November was a modest sized book, with just 66 lots available on the day. However, this in part reflected the high number of lots sold prior to the auction, and an overall success rate of 80% marks an improvement compared to many recent auctions.
The highest price achieved on the day was £2.7m (5.8% initial yield) for an industrial estate in Burton-on-Trent, part-let to Howdens. The auction room continues to act as a useful clearing house for smaller shopping centres, with the Forum in Sittingbourne selling for £2.19m (21.3% IY, £28/sq ft).
|
Market forecasts
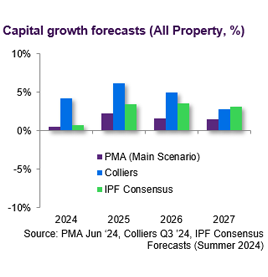
Real estate advisory Colliers are one of the more bullish voices on the market. Their most recent forecasts, published in September, imply that average capital values will rise by 4% in the final two months of the year and by more than 16% cumulatively by the end of 2026.
Colliers expect the Industrial sector to continue to outperform, with a capital growth forecast of 7.5% for this year implying a surge of almost 5% in November/December. They expect values to end 2026 20% higher than they are today. This growth is expected to be underwritten by rental growth of 4% per annum, as well as a moderate degree of yield compression.
Colliers anticipate a more gradual recovery for Retail, with circa 10% capital growth expected by the end of 2026. On a total return basis, Retail Warehouses are expected to produce the strongest returns of all sub-sectors (10.4% p,a,) even outperforming Industrial (10% p.a.)
The prediction for flat office values in 2024 implies a significant rebound before the end of the year, though it’s worth pointing out that the forecasts were produced before the recent sharp outward movement in Gilt yields. Forecast medium-term total returns for the sector look relatively modest at 6.6% p.a.
|
|
Looking forward
| From a property investor’s perspective, there are of course still a very large number of potential customers within the student sector. Even if the overseas numbers for 2024/25 are as bad as projected by the OFS, there are still expected to be well over two million full-time students in the UK next year. Nonetheless, for a sector that has got used to growth, some institutions and by extension some PBSA schemes are going to find themselves with significantly fewer customers than they were budgeting for. The clear conclusion therefore is that stock selection becomes ever more crucial. In recent years, backing the wrong asset maybe meant missing out on the stellar rental growth achieved by others. Yet this year, it probably means reduced occupancy and possibly struggling to break even. Serving the right institutions is obviously a key factor in stock selection. UCAS data from the last academic year shows that acceptances to lower tariff universities were down by more than 5% year-on-year, and OFS modelling assumes a 25% reduction in overseas students for those same institutions this year.
|
Visit us
Discover a wealth of
real estate expertise, regardless of your business level or stage.

|
| Whilst the risk of severe financial distress may be highest therefore amongst those lower tariff institutions, many mid and higher tariff universities are still likely to deliver less growth in student numbers than forecast, which will in turn impact property investors. Some cities, such as Bristol, have such a shortage of beds that investors are unlikely to lose too much sleep over a moderate undershoot in student numbers across the city. In contrast, the supply/demand balance is much more delicate in many other locations, and it is here that performance between individual schemes is likely to diverge most dramatically. Micro-location is critical, and investors are likely to discover that when push comes to shove domestic students will usually take proximity to the lecture hall (and student union) over a premium fit-out further afield. Management track record and brand strength will also be key differentiators. Prospective students rely very heavily on online reviews, and operators with a clear reputation of delivering for customers will be the ultimate defence in an increasingly competitive market. |
|
|
If you would like to opt out, please get in touch with your Relationship Manager.
This document has been prepared by National Westminster Bank Plc or an affiliated entity (“NatWest”) exclusively for internal consideration by the recipient (the “Recipient” or “you”) for information purposes only. This document is incomplete without reference to, and should be viewed solely in conjunction with, any oral briefing provided by NatWest. NatWest and its affiliates, connected companies, employees or clients may have an interest in financial instruments of the type described in this document and/or in related financial instruments. Such interests may include dealing in, trading, holding or acting as market-maker in such instruments and may include providing banking, credit and other financial services to any company or issuer of securities or financial instruments referred to herein. NatWest is not and shall not be obliged to update or correct any information contained in this document. This document is provided for discussion purposes only and its content should not be treated as advice of any kind. This document does not constitute an offer or invitation to enter into any engagement or transaction or an offer or invitation for the sale, purchase, exchange or transfer of any securities or a recommendation to enter into any transaction, and is not intended to form the basis of any investment decision. This material does not take into account the particular investment objectives, financial conditions, or needs of individual clients. NatWest will not act and has not acted as your legal, tax, regulatory, accounting or investment adviser; nor does NatWest owe any fiduciary duties to you in connection with this, and/or any related transaction and no reliance may be placed on NatWest for investment advice or recommendations of any sort. Neither this document nor our analyses are, nor purport to be, appraisals or valuations of the assets, securities or business(es) of the Recipient or any transaction counterparty. NatWest makes no representation, warranty, undertaking or assurance of any kind (express or implied) with respect to the adequacy, accuracy, completeness or reasonableness of this document, and disclaims all liability for any use you, your affiliates, connected companies, employees, or your advisers make of it. Any views expressed in this document (including statements or forecasts) constitute the judgment of NatWest as of the date given and are subject to change without notice. NatWest does not undertake to update this document or determine the accuracy or reasonableness of information or assumptions contained herein. NatWest accepts no liability whatsoever for any direct, indirect or consequential losses (in contract, tort or otherwise) arising from the use of this material or reliance on the information contained herein. However, this shall not restrict, exclude or limit any duty or liability to any person under any applicable laws or regulations of any jurisdiction which may not be lawfully disclaimed. The information in this document is confidential and proprietary to NatWest and is intended for use only by you and should not be reproduced, distributed or disclosed (in whole or in part) to any other person without our prior written consent.
National Westminster Bank Plc. Registered in England & Wales No. 929027. Registered Office: 250 Bishopsgate, London EC2M 4AA. National Westminster Bank Plc is authorised by the Prudential Regulation Authority, and regulated by the Financial Conduct Authority and the Prudential Regulation Authority.
|
|
|