If you cannot see the graphic or access the links within this message please go to the source
|
 |
 |
|
Relative value is beacon of optimism amidst the economic gloom
Commercial real estate valuations are 25% below where they were 18 months ago. Yet without any context this tells us very little about whether current pricing represents good value. The real yardsticks of value are often relative concepts. How much does a house cost relative to earnings? What income does an asset yield compared to the risk-free rate? What are the expected returns of UK real estate relative to other countries or asset classes? Assessing the UK property market against such relative measures can provide much-needed clarity amidst the fog of an unpromising macro-economic environment. For equity investors, the bedrock of any assessment of value should be the return which they could achieve without taking any risk. For a brief period last summer, a private investor could get 6.2% interest on a 12-month savings product with NS&I, a risk-free yield that set a high hurdle for any forays into a volatile property market. For Institutional investors the ten-year Gilt yield would be a more typical benchmark, and for much of the second half of last year that hovered around 4.5%.
Against such a backdrop it is hardly surprising that investment activity waned and property yields drifted out, pushing values down yet further. Even sectors such as Industrial, student accommodation and PRS, which have delivered reliable and robust income growth in recent years, suffered from shallow liquidity and soft pricing. However, the rates outlook has changed markedly in the last three months, with markets now confident that base rate has peaked and will trend down materially later this year. The best NS&I rate, and the ten-year Gilt yield, are now both below 4%, whilst five-year swap rates are down by around 100bp from their peak. Within this context, prime property yielding 4.5% to 7.5%, with the potential for an inflationary kicker, now represents a solid investment case. Other relative perspectives also offer support. UK property values have rebased faster than most other markets, and the UK has returned to the top of many multi-national investor target lists. From a multi-asset perspective, what once looked like an uncomfortably overweight position in real estate for many investors has also largely reversed in recent months as bond and equity markets have rebounded.
|
|
Commercial property returns
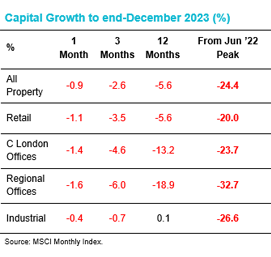
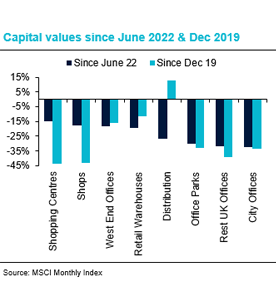
- A period of apparent stabilisation in H1 2023 was followed by a second lurch downwards in H2. This followed the trajectory of interest rate expectations which deteriorated markedly in Q3. Capital values declined by 5.6% in 2023, and are down by 24.4% from the June ‘22 peak.
- The Office sector was by some distance the wort performing sector this year (-16.6%) and has now fallen the furthest since the June ’22 peak (-29.2%). The City of London was one of the weakest office regions in 2023 (-21%) and is down by 32.4% from peak. In contrast, the West End has proved relatively resilient (-8.7% in 2023 and -18.5% from peak).
- Retail values had been broadly stable in the first half of the year, but ended the year at -5.6% after a weak final quarter. Nonetheless, the sector has proved relatively resilient and it is notable that rental values appear to have stabilised, delivering marginal growth in 2023.
- The Industrial sector, which had returned to moderate capital growth in H1 was not immune to the double dip in H2. Across the year as a whole, capital values ended up flat and are still 26.6% off their June 2022 peak. Rental value growth remains robust at 7.6% year-on-year, slightly down from 10.3% in 2022, but still above the 5-year average of 6.5%.
|
|
Investment market activity
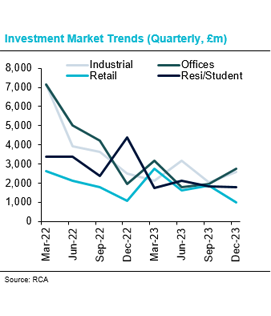
- Investment market activity picked up somewhat in December, with RCA recording £3.9bn of transactions in December, up from just £2.4bn in November. However, the December total was 47% down year-on-year, and 2023 as a whole was 40% down on 2022.
- The largest individual deal recorded in December was the sale of two Hoxton hotels, in Shoreditch and Holborn, for a combined £212.6m. The hotels were acquired by Archer Hotel Capital, a specialist hotel investment vehicle backed by GIC and APG. The hotels were originally marketed in April, alongside a third in Southwark, at a reported asking price of £450m.
- The largest deal to complete in a very quiet Central London office market, was the sale of 125 Shaftesbury Avenue, which had been leased to WeWork, and sub-let to Facebook, but is now vacant. The asset was sold to a JV led by Mitsubishi Estates for £148m, reflecting a very large reduction in value from the previous sale price of £267m in 2018.
- Aviva Investors acquired a portfolio of predominantly student assets from Curlew Capital for £150m. The six student assets, comprising over 1,000 beds, are located in Edinburgh, Liverpool, Exeter and Falmouth. Curlew Capital will remain as the operating partner.
- A smattering of mid-sized retail deals completed in January. The largest was a portfolio of Sainsbury’s and Morrisons supermarkets, acquired by Aviva Investors for £98m. Elsewhere, Springvale Retail Park in Orpington was sold by Blackrock for £45m (7.5% yield). Pavilions Shopping Centre in Hillingdon was sold for £19m, representing a price of £39 per square foot. It last sold in 2013 for £64.5m / £134 per sq ft.
|
|
Market yields
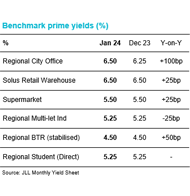
- Despite recent volatility, medium-term interest rates have trended materially lower over the last three months. Markets are predicting that base rate will start to come down around mid-year and end the year around 4.0-4.25%. Five years swaps are down from 4.6% in October to around 3.75% today.
- Investment activity remains subdued, making estimates of current market pricing challenging. However, JLL consider that recent activity in the retail park and supermarket sectors provide evidence of a stabilisation of yield benchmarks. Prime benchmarks for retail parks (6.25%) and supermarkets (5.50%) had moved out by 175bp and 200bp respectively since June ’22.
- In contrast, JLL perceive that pricing for office markets outside Central London remains under downward pressure. JLL estimate that prime benchmarks for Regional Cities, Greater London and the South East softened by a further 25bp since December to 6.5%, 7.0% and 7.25% respectively. These benchmarks have each moved out by 200bp since mid-2022.
- Despite improving financing costs and a significant reduction in the risk-free rate, JLL consider that benchmarks for high street retail, shopping centres, industrial, residential and student remain under outward pressure. Industrial benchmarks are around 175bp out from June ’22, whilst residential and student yields have only moved out by 25-75bp over the same period.
|
|
Auctions
- Allsop’s commercial auction in December was relatively small, raising £46.6m compared to £66.7m in October. However, it was notable for larger lot sizes, as funds continued to use the auction room as a way of shifting stock. The Rochdale Exchange shopping centre sold for close to £5m, representing a notional gross yield of around 36%, and circa £18 psf.
- Supermarket income is consistently popular with private investors, and two Tesco stores with new 15-year leases in Enfield and Sandy sold at yields of around 6%. Residential angles also remain a draw; a WH Smith in Chiswick with residential development potential sold for £2.3m (a 6.23% yield).
|
|
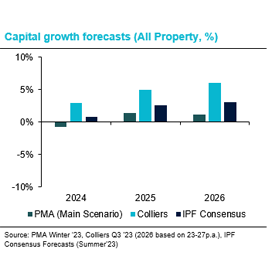
Market forecasts
- Independent forecasters PMA released their forecast update in December, predicting further capital value declines for most sectors in 2024, but at a much lower rate than those seen last year. The average decline is forecast to be just 0.7%, but a wide disparity between sectors is anticipated.
- The Industrial sector is expected to buck the trend in this year with PMA expecting capital values to rise by 3.8% on average. This is expected to be well underwritten by average rental growth of 3.1%. Multi-let industrial values (4.6%) are expected to grow at around twice the rate of distribution (2.2%), whilst London is expected to outperform the regions.
- Retail values are expected to drift down again this year, by 2.9% on average, with shopping centres continuing to lag the sector (-4.5%). The rental growth outlook is relatively benign, with marginal growth of 0.8% predicted on average this year. However, the picture for income growth is slightly weaker (-2.0%) as overrenting continues to wash through the system.
- PMA expect Offices to underperform for the second consecutive year in 2024, with capital values expected to decline by a further 5.4% in the year. That would take the average decline from peak to around 30% by the end of next year. PMA predict a wide divergence this year between Central London (-1.8%) and provincial markets (circa -10%).
|
|
Looking forward
Following the rapid adjustment in commercial property values recorded over the last 18 months, they are now well below long-term trends, and cyclical risk now looks very low. In fact, from a cyclical standpoint risk looks lower at the start of 2024 than in any year since 2010. The macro-economic picture may not be particularly rosy, but it rarely is at this point in the cycle. Indeed, whilst we are just coming off a year of economic stagnation, in 2010 we were only just emerging from the deepest recession in living memory. Unemployment at the start of 2010 was almost double what it is today. Meanwhile, inflation is firmly trending downwards, and earnings growth of 6.6% is delivering a much-needed improvement to disposable incomes. Of course, the base rate in January 2010 was 0.5% compared to 5.25% today, yet the five-year swap back then was around 3.4%, not far below where we are today, and the financial system is on a far stronger footing today than it was back then.
Of course, cyclical risk is just one factor. Idiosyncratic risk - incorporating leasing, tenant failure and local market risks specific to a particular property – And structural risks of accelerated obsolescence, are still alive and well. The latter remains a defining factor for shopping centres, and is increasingly being perceived as the key risk for older offices. Nonetheless, on a range of metrics the market looks to be at worst fair value and it would take a very malign economic backdrop not to support healthy total returns over a five-year horizon. To return to the relative theme, the required return for property does not look too taxing. With the Risk-Free Rate at around 4%, prime property needs to deliver a minimum return of around 6% to compensate for risk. Prime build to rent, student, industrial and supermarket assets would only require rental growth of 1-2%, to deliver such a return, hardly a challenging hurdle. Whilst well-chosen assets in other sectors could comfortably deliver such a return without having to rely on rental growth at all.
|
|
For further information please contact:
Author – Tom Sharman, Head of Strategy & Insight, Real Estate Finance, NatWest Group
For further info contact:
Ross Ironside
Coutts & Co - Head of Commercial Real Estate
E-mail: Ross.ironside@Coutts.com |
|
This document has been prepared by National Westminster Bank Plc or an affiliated entity (“NatWest”) exclusively for internal consideration by the recipient (the “Recipient” or “you”) for information purposes only. This document is incomplete without reference to, and should be viewed solely in conjunction with, any oral briefing provided by NatWest. NatWest and its affiliates, connected companies, employees or clients may have an interest in financial instruments of the type described in this document and/or in related financial instruments. Such interests may include dealing in, trading, holding or acting as market-maker in such instruments and may include providing banking, credit and other financial services to any company or issuer of securities or financial instruments referred to herein. NatWest is not and shall not be obliged to update or correct any information contained in this document. This document is provided for discussion purposes only and its content should not be treated as advice of any kind. This document does not constitute an offer or invitation to enter into any engagement or transaction or an offer or invitation for the sale, purchase, exchange or transfer of any securities or a recommendation to enter into any transaction, and is not intended to form the basis of any investment decision. This material does not take into account the particular investment objectives, financial conditions, or needs of individual clients. NatWest will not act and has not acted as your legal, tax, regulatory, accounting or investment adviser; nor does NatWest owe any fiduciary duties to you in connection with this, and/or any related transaction and no reliance may be placed on NatWest for investment advice or recommendations of any sort. Neither this document nor our analyses are, nor purport to be, appraisals or valuations of the assets, securities or business(es) of the Recipient or any transaction counterparty. NatWest makes no representation, warranty, undertaking or assurance of any kind (express or implied) with respect to the adequacy, accuracy, completeness or reasonableness of this document, and disclaims all liability for any use you, your affiliates, connected companies, employees, or your advisers make of it. Any views expressed in this document (including statements or forecasts) constitute the judgment of NatWest as of the date given and are subject to change without notice. NatWest does not undertake to update this document or determine the accuracy or reasonableness of information or assumptions contained herein. NatWest accepts no liability whatsoever for any direct, indirect or consequential losses (in contract, tort or otherwise) arising from the use of this material or reliance on the information contained herein. However, this shall not restrict, exclude or limit any duty or liability to any person under any applicable laws or regulations of any jurisdiction which may not be lawfully disclaimed. The information in this document is confidential and proprietary to NatWest and is intended for use only by you and should not be reproduced, distributed or disclosed (in whole or in part) to any other person without our prior written consent.
National Westminster Bank Plc. Registered in England & Wales No. 929027. Registered Office: 250 Bishopsgate, London EC2M 4AA. National Westminster Bank Plc is authorised by the Prudential Regulation Authority, and regulated by the Financial Conduct Authority and the Prudential Regulation Authority. |
|
|