If you cannot see the graphic or access the links within this message please go to the source
|
 |
 |
|
Capital values are falling again, yet rents paint a more subtle picture
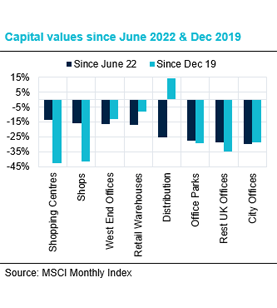
The double-dip is upon us. Having apparently stabilised in the Spring, commercial property values have been falling once again since June. The exact picture varies, but since the start of Summer the trend rate of value growth has deteriorated markedly across all three mainstream commercial sectors. So, what happened to cause this renewed bout of introspection? The most obvious macro factor was rate expectations. For a period in the spring, it appeared that with inflation falling rapidly base rate might peak at 4.5%. However, some disappointing inflation figures were followed by a surprise 50bp hike to base rate in June and further 25bp in August. Crucially for investor sentiment, medium-term interest rates spiked, with markets at one point pricing in a 6% base rate. This period of extreme pessimism on rates triggered a further outward shift in property yields and a resulting step down on values.
This change in sentiment is illustrated in the Monthly Yield Sheet published by real estate advisory JLL. In May, of the 51 market segments monitored by JLL, thirty were deemed to be “stable”, whilst eleven were “stronger” and just ten were “weaker”. Roll forward to the November update and just twelve segments were perceived as stable, whilst thirty-nine were seen as trending weaker and not one was considered to be trending stronger. This dramatic change in value perception highlights the market’s fragile confidence and ongoing sensitivity to rates. It is good news indeed therefore that base rate has not gone any higher since August and that rate expectations, and consequently medium-term interest rates, have moderated very significantly. Whilst the timing and scale of any cuts is uncertain, the market is at least confident that base rate has peaked. This then perhaps allows investors to return their focus to rental growth, which has continued to defy the challenging macro-economic backdrop. Over the last six months, rental values in the MSCI Monthly index have quietly grown at an average annualised rate of 3.4%, with 60 out of 73 market segments showing some level of growth over that period.
|
|
Commercial property returns
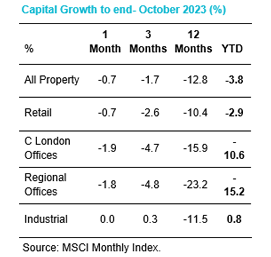
- The rate of decline in the MSCI Monthly Index has picked up again in recent months, with capital values down by 3.8% in the last 3 months, compared to just 1% across the preceding three months. This decline has been driven by yield shift, whilst rental values continue to edge upwards.
- The Office sector has been the clear underperformer this year (-13.4%), and this trend has shown no signs of improving. Indeed, some regions have deteriorated in recent months; notably City offices, where a 9% decline in H1 has been followed by a further 10% in the four months since.
- Retail values had shown signs of stabilisation and were broadly flat in H1, yet they are now down by around 2.5% quarter-on-quarter. However, whilst capital value trends are negative, it was notable that rental values rose quarter-on-quarter in all four sub-sectors for the first time in six years.
- Whilst the Industrial sector remains the most resilient, some of the steam has come out of the recovery in the last couple of months. Capital values have only edged up by 0.3% over the last 3 months, compared to 1.2% in Q2. Notably however, rental growth remains relatively robust, up by 1.6% in the last 3m and by 7% year-on-year.
|
|
Investment market activity
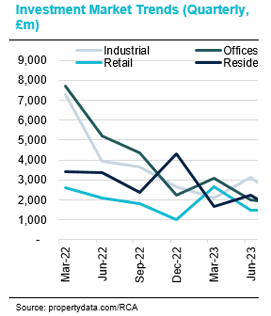
- According to Real Capital Analytics, only £1.25bn of deals transacted in October. Although this number may be revised upwards over the coming weeks, it looks to have set a new low as the weakest month on record. The year-to-date figure of £31.1bn is 45% down on last year.
- The largest deal to close in October was the sale of Co-op’s HQ at One Angle Square in Manchester. The reported sale price of £140m was almost identical to the previous time the asset was traded in 2013, yet the yield has risen from 6.3% to 8.3%, reflecting robust rental growth. The asset was previously marketed in June 2022 at a price of £210m.
- In what was a remarkably quiet month for London office deals, the highest value trade in the Capital was for a Retail asset. Retailer Swatch Group acquired the Harry Winston store on New Bond Street for £80.6m, (£14.6k per sq ft). Vendors Circle Property, who own several Bond St assets, acquired the property 10 years ago for £31.15m (£5.6k per sq ft).
- The JV between Brookfield and Copley Point Capital acquired three distribution warehouses at Heathrow airport from Hermes for £54m (£245/sq ft). The assets comprising 220k sq ft are air cargo logistics hubs for DHL, Circle Express and Air Menzies.
- The largest London office deal in October was the sale of 99 Queen Victoria Street, in the City, by WeWork Property Investors. The reported sale price of £48m is well down on both the original asking price of £70m and the £68m paid by WeWork in 2019. The asset was acquired by Fidelity’s Climate Impact Fund, who plan to refurbish it to BREEAM Excellent and NABERS 5 Star standards.
|
|
Market yields
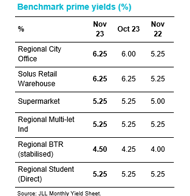
- Medium-term interest rates have trended lower over the last month, with the market predicting that rates have now peaked and will start to come down in mid-2024. Nonetheless, the majority of benchmark yields across a whole range of sectors are still perceived to be softening.
- Benchmarks for Build-to-Rent had been remarkably resilient in the face of rising interest rates, perhaps reflecting the fact that higher mortgage costs would result in more rental demand. However, upwards pressure on yields has started to show through since mid-year and JLL report that most benchmarks have drifted out by a further 25bp in the last month.
- Most Retail and Office benchmarks remain under outward pressure. The Dominant Shopping Centre benchmark moved out to 7.75%, a 50bp shift in the last 3 months. Solus Retail Warehouse and Supermarket benchmarks moved from Stable to Weaker. Regional City prime and Sub-Regional City prime office benchmarks softened by 25bp to 6.25% and 7.75% respectively.
- Industrial benchmarks have been stable at their current levels for the last 12 months, yet JLL indicate that they also are now under renewed outward pressure. That leaves just one benchmark stable and unmoved over 12 months; the sub £40m West End office prime yield benchmark, which continues to attract support at 3.75%, 50bp below the risk-free rate.
|
|
Auctions

- Allsop’s commercial auction in October raised £66.7m, significantly ahead of the previous auction in September (£42m) but 14% down on the equivalent auction in 2022 (£77.3m). The average lot size on the day was unusually high at £1m, reflecting the number of funds and REITS who used the auction room as a backstop to failed private treaty sales processes.
- A Tesco Express in Oxford with a new 15-year lease sold for £1.05m, reflecting a yield of just under 5.5% despite a break in year 10 and the absence of any index-linked uplifts. A Farmfoods in Birkenhead, on a new 20-year lease with no breaks sold for £928k (6.6% yield).
|
|
Market forecasts
- Real Estate adviser Colliers released their updated commercial property forecasts in September. They downgraded their capital forecasts for 2023 and 2024 but continue to believe that this will be followed by a robust recovery. Their forecasts imply that values will end 2027 20% higher than they are today.
- At a sector level, Colliers publish total return forecasts rather than capital growth, but these forecasts imply that capital values are close to the bottom across the main sectors. The Industrial sector is predicted to outperform once more, with an average total return of 10% per annum between 2023 and 2027.
- The picture for Retail is also relatively sanguine at a sector level, with a return to moderate capital growth from next year. Any recovery in the office sector is expected to be limited, with total returns through 2027 appearing to be broadly consistent with an income return.
- In line with many other commentators, Colliers remain optimistic from a rental growth perspective, with most sub-sectors expected to see net growth between now and 2027. They are most bullish on Industrial at 4.3% per annum, followed by Retail Warehouses and West End Offices, at 1.9% and 1.7% respectively. In contrast, the expect shopping centre rents to continue to drift lower.
|
|
Looking forward
At an aggregate level, real rental growth is highly correlated with economic growth and there is not expected to be too much of that going around over the next year or two. However, with elevated inflation still flowing through the economy, rental values in most sectors have been falling both as a proportion of revenues and relative to other business costs. Therefore, it’s entirely conceivable that we will continue to see moderate levels of rental growth even in a low economic growth environment. Whilst property is rarely if ever a perfect inflation hedge, the ability to capture some upside from broader inflationary trends is a clear advantage for property over fixed income. With capital values having come off further in recent months and rental values continuing to rise, property yields have risen even as interest rates have moved in the opposite direction.
Of course, as was ever the case in real estate, individual sectors, sub-markets and properties will experience wildly different trends. Whilst moderate rental growth seems likely at a market level, underlying assets will experience greater extremes, and nowhere will this be more apparent than in the office sector. Whilst all the debate is around the impact of remote working on occupier demand, prime office rents have been setting new records in many cities across the country. These rents of course represent the best assets in the best locations, and competition from occupiers is fierce. In contrast, older assets in less desirable locations that don’t match evolving occupier demand will be in a race to the bottom. For Industrial assets, MSCI report that rental values are still growing at an annualised rate of more than 6%, and in some cases much more. It’s a similar story for rental accommodation and student housing, where demand continues to outstrip supply in most locations. Perhaps the least remarked on but possibly the most notable trend is in the Retail sector. For the first time since 2017, all four retail formats saw quarter-on-quarter rental growth. The growth was marginal, but after the last decade most investors in the sector would gladly embrace stability. |
|
For further information please contact:
Author – Tom Sharman, Head of Strategy, Real Estate Finance, NatWest Group
For further info contact:
Ross Ironside
Coutts & Co - Head of Commercial Real Estate
E-mail: Ross.ironside@Coutts.com |
|
This document has been prepared by National Westminster Bank Plc or an affiliated entity (“NatWest”) exclusively for internal consideration by the recipient (the “Recipient” or “you”) for information purposes only. This document is incomplete without reference to, and should be viewed solely in conjunction with, any oral briefing provided by NatWest. NatWest and its affiliates, connected companies, employees or clients may have an interest in financial instruments of the type described in this document and/or in related financial instruments. Such interests may include dealing in, trading, holding or acting as market-maker in such instruments and may include providing banking, credit and other financial services to any company or issuer of securities or financial instruments referred to herein. NatWest is not and shall not be obliged to update or correct any information contained in this document. This document is provided for discussion purposes only and its content should not be treated as advice of any kind. This document does not constitute an offer or invitation to enter into any engagement or transaction or an offer or invitation for the sale, purchase, exchange or transfer of any securities or a recommendation to enter into any transaction, and is not intended to form the basis of any investment decision. This material does not take into account the particular investment objectives, financial conditions, or needs of individual clients. NatWest will not act and has not acted as your legal, tax, regulatory, accounting or investment adviser; nor does NatWest owe any fiduciary duties to you in connection with this, and/or any related transaction and no reliance may be placed on NatWest for investment advice or recommendations of any sort. Neither this document nor our analyses are, nor purport to be, appraisals or valuations of the assets, securities or business(es) of the Recipient or any transaction counterparty. NatWest makes no representation, warranty, undertaking or assurance of any kind (express or implied) with respect to the adequacy, accuracy, completeness or reasonableness of this document, and disclaims all liability for any use you, your affiliates, connected companies, employees, or your advisers make of it. Any views expressed in this document (including statements or forecasts) constitute the judgment of NatWest as of the date given and are subject to change without notice. NatWest does not undertake to update this document or determine the accuracy or reasonableness of information or assumptions contained herein. NatWest accepts no liability whatsoever for any direct, indirect or consequential losses (in contract, tort or otherwise) arising from the use of this material or reliance on the information contained herein. However, this shall not restrict, exclude or limit any duty or liability to any person under any applicable laws or regulations of any jurisdiction which may not be lawfully disclaimed. The information in this document is confidential and proprietary to NatWest and is intended for use only by you and should not be reproduced, distributed or disclosed (in whole or in part) to any other person without our prior written consent.
National Westminster Bank Plc. Registered in England & Wales No. 929027. Registered Office: 250 Bishopsgate, London EC2M 4AA. National Westminster Bank Plc is authorised by the Prudential Regulation Authority, and regulated by the Financial Conduct Authority and the Prudential Regulation Authority. |
|
|